
So you’ve had your hearing tested – congratulations! You have completed the first step in your hearing healthcare journey. Now hopefully, you had your hearing tested at AudioSense, where our Audiologists truly take the time to educate patients about their results and what it means, using clear and simple language. When you leave AudioSense, you will feel confident that you understand your results, what it means for your hearing and overall health, and what you should do next.
But let’s say you had your hearing tested somewhere else. Hopefully, you spent time with the hearing healthcare provider to review your results. If not, you might think you are looking at a game of Tic-tac-toe rather than a hearing test. This blog will cover the basics of how to read an audiogram, and give you a better understanding of your hearing test results.
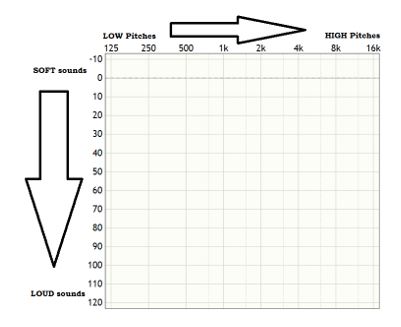
Your hearing results will be plotted on a graph called an Audiogram.
The X-axis of the Audiogram (going left to right) indicates different frequencies, or pitches, measured in hertz (Hz). Just like a piano, the low pitched notes start to increase to higher pitched notes as you move from left to right.
The Y-axis of the Audiogram (going top to bottom) indicates the intensity, or loudness, measured in decibels (dB). Softer sounds are at the top of the graph, and the volume increases as you go down to the lower part of the graph.
So what would an audiogram look like for someone with completely normal hearing?
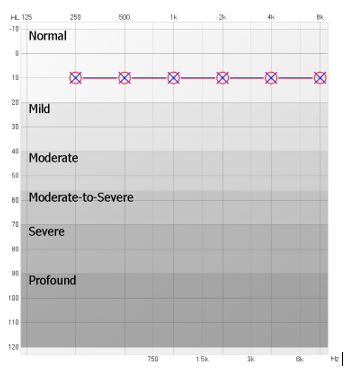
Let’s take a look at this example audiogram. Remember, all of the marking in red circles are the results for the right ear and all of the markings in blue X’s are the results for your left ear. In this example, the O’s and X’s are lined up perfectly – this means the left and right ears have identical hearing. We can also see that all of the O’s and X’s for each of the different pitches, moving from left to right on the audiogram, are close to the top of the graph. This means that this person is able to hear all the different pitches at a very soft volume.
Let’s look at an audiogram with a hearing loss.
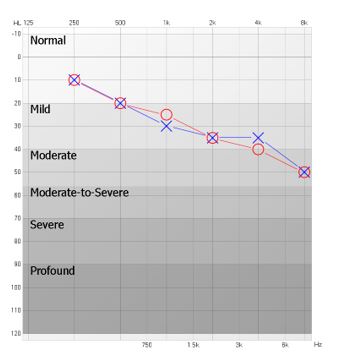
Once again, in this example audiogram, the X’s and O’s are following the same pattern, meaning that both ears are equal in hearing. However, this shows that the hearing starts out in the normal range for low-pitch sounds, and then declines for higher pitched sounds. This indicates a moderate high-frequency hearing loss in both ears.
A person with this type of hearing might notice difficulty hearing conversations when there is background noise present. This person might find that if someone is speaking at a distance, or with their back turned, it is very difficult to understand them. This person might also notice that they mix up certain sounds, and are asking for repetition or clarification.
About the Author

Lauren Schofield
Inspired by her younger brother’s experience with hearing loss, Lauren pursued a career in audiology after completing a Health Science degree at Western University. She earned her Master's in Communication Disorders in London, Ontario, with a special interest in pediatric audiology. Her professional experience includes work at pediatric centres in Kelowna and Toronto, including The Hospital for Sick Children and Humber River Hospital. With a lifelong love of music from her background in competitive dance, she is passionate about helping others hear in meaningful ways. In Lauren's free time, she enjoys live music, cooking, and spending time outdoors.


